| Previous |
Q 7) Draw a bar graph:
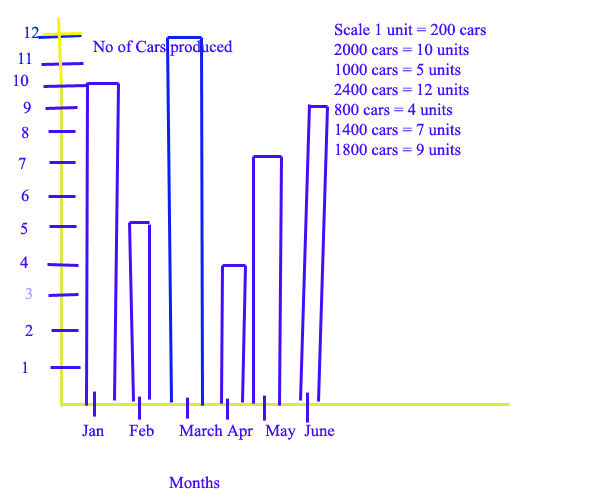
Following is the information about the number of cars produced by a company in 6 months. Draw bar graph to represent this information.
Take 1 unit = 200 cars
| Months | No of cars priduced |
| Jan | 2000 |
| Feb | 1000 |
| March | 2400 |
| April | 800 |
| May | 1400 |
| June | 1800 |
Solution:
Scale 1 unit = 200 cars
Therefore ? units === 2000 cars
Cross Multiply we get ? x 200 = 2000
? = 2000/200 = 10 units
In similar fashion all the other calculations are done.